-
 Try out the new Jake: AI Coding Assistant for LabVIEW!
Get answers to questions about LabVIEW and discuss your code.
Advanced Plotting by Heliosphere Research LLC - Toolkit for LabVIEW Download
| Version | 1.1.0.136 |
| Released | Jul 20, 2023 |
| Publisher | Heliosphere Research LLC |
| License | BSD-3-Clause |
| LabVIEW Version | LabVIEW>=11.0 |
| Operating System | Windows |
| Used By | nevstop_3rdparty_dependencies |
| Project links | Homepage Documentation Repository |
Description
The Advanced Plotting Toolkit is an add-on package for LabVIEW that lets you create professional-quality graphs and plots directly from the block diagram.
Plots are displayed on the front panel using full 24 bit color and antialiasing. With a single subVI call, they can also be saved to disk in one of half a dozen standard formats, including PDF.
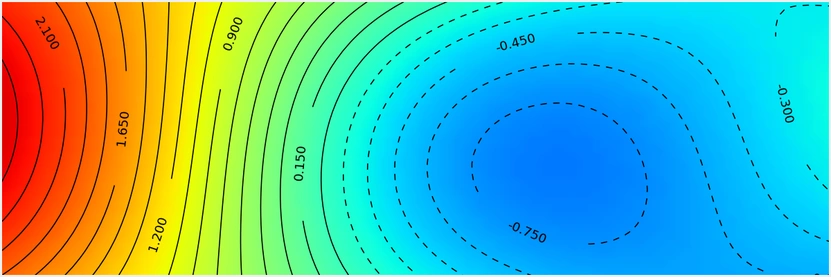
You can create advanced visualizations including line and filled contour maps, 2D histograms, vector arrow fields, streamline plots, and more. All common graphs are also supported, including line, bar, scatter and histogram plots.
The Toolkit supports variable transparency (alpha blending) and professionally-formatted math text using the LaTeX markup language. Vector art is used for all plotting operations, which means that your figures can be arbitrarily resized at any time without loss of detail, fonts and math symbols will look amazing, and your saved plots will always come out with razor-sharp clarity.
Requires VI Package Manager (VIPM) 2014 or later for installation. VIPM 2014 is a free download from JKI.
This open-source project is supported by the LabVIEW community, at:
https://decibel.ni.com/content/groups/advanced-plotting-toolkit
Release Notes
Repackaged for compatibility with newer versions of Windows OS
